With the increasing number of systems and installed sensors in a smart city, there is a need for a data analysis system to process the information obtained from these systems in order to monitor the performance of these systems and city traffic through an advanced surveillance system. The Kaavosh data analysis system, utilizing artificial intelligence, algorithms, and prominent data processing platforms, monitors city-level traffic parameters and the performance of existing systems 24/7 and presents the processed traffic data on a dashboard. By continuously monitoring the data in real-time, this system enhances the accuracy of traffic analysis and system performance, executing algorithms that are beyond the capabilities of human resources
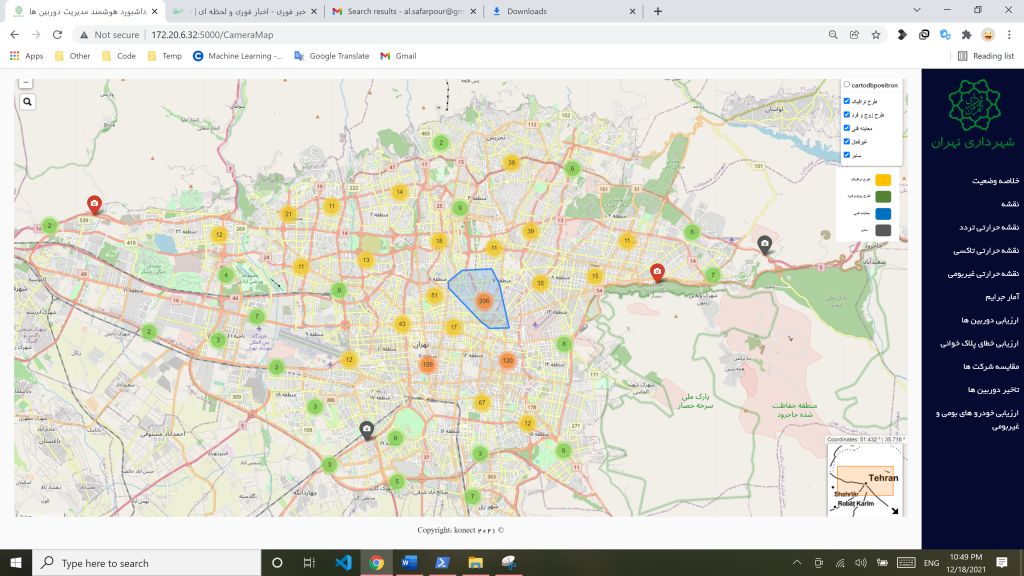
Data Analysis System, Kaavosh
Software features
Here is the translation of the text
“Online viewing of camera information, categorized by system type (even-odd scheme, traffic light, etc.).
Viewing camera status (active and inactive).
Viewing information about inactive cameras (company name, camera number, etc.).
Viewing the number of records sent by each camera, sorted by hour (last 24 hours).
Checking the camera’s connection status with the database (system network outage).
Checking camera performance status (failure to record traffic and violations).
Estimating camera traffic and comparing it with the number of records sent (predicting undesirable camera performance in vehicle identification).
Ability to select license plate types (taxis, non-local vehicles, all vehicles).
Playback of thermal map videos, sorted by hour in the past 24 hours.
Display in logarithmic and thermal form. Viewing camera errors, sorted by numbers, letters, and Iranian code.
Displaying the number and percentage of misread elements incorrectly and the correct rate. Displaying the most frequently occurring errors for each camera.
Number and percentage of errors in license plate reading, categorized by company and license plate elements.
Viewing the status of the intelligent checking system and the number of plates corrected by the checking system or referred to manual checking.
Calculating camera delays, categorized by company and system type.
Categorizing cameras into 4 delay categories (low, medium, high, very high).
Viewing the average delay of cameras, categorized by company and system type.
Examining the delay status of companies based on the number of cameras in delay categories. Viewing the top ten cameras with the highest and lowest recorded delays.
Viewing the number of violations and traffic records sent, categorized by violation code and executing company.
Viewing the number of violations sent by each company, categorized by violation code
Hardware Features
Real-time and fast online processing of massive data with 20 million records in 60 seconds Distributed processing and storage capability.
Software and hardware scalability.
Ability to aggregate information online from different systems